It may be interesting to think about this by analogy to latent heat in phase transition. Latent heat is what substance needs to complete phase transition (eg. from ice to water, liquid to gas). If the heat added is less than the latent heat, phase transition remains incomplete. So, in terms of quantitative easing, latent heat corresponds to the certain amount of money which is needed to change the state of economy.
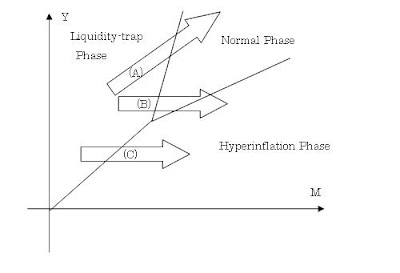
Speaking of phase transition, it may be also interesting to draw phase diagram in monetary policy. If you compare liquidity-trap economy to solid phase, normal economy to liquid phase, and hyperinflation economy to gas phase, it goes like this:

Here I took money supply M as X-axis(temperature in actual phase transition), and real output Y as Y-axis(pressure in actual phase transition).
Arrow (A) is what quantitative easing aims at. That is, by the appropriate increase in money, economy makes transition from liquidity-trap phase to normal phase.
However, if you do too much, the economy may jump over normal phase and move into hyperinflation phase(arrow (B)).
Or, real economy may not be strong enough to move back to normal state in the first place, and economy may move directly into hyperinflation phase(arrow (C)).
These scenarios are what inflationistas worry about.
BTW, I've also done some maths on this analogy, and will explain them in later post(s).
0 件のコメント:
コメントを投稿